What are your restaurant metrics telling you?
Technology gives us access to an abundance of data. Customer data. Performance data. Operational data. If you wanted, you could use data to measure how much each grain of rice contributes to your bottom line. If you wanted.
But all metrics aren’t created equal. In this article, we’ll go through 21 essential restaurant calculations that will keep your restaurant’s profit margins on track, please your customers, and make sure your business operations run as smooth as a whistle.
Drive your business with sales reports, food costs, customer satisfaction survey, and more.
Operational Metrics & Costs
1. Cost of Goods Sold (CoGS)
What does CoGS measure?
Cost of goods sold, or CoGS, is the cost required to make each menu item you sell. This number represents the total amount you need to spend on inventory and materials to produce your food and beverage (F&B) sales over a period of time.
Why CoGS is important to measure
Calculating CoGS helps you determine whether:
- menu items are priced well or too low
- inventory controls are working
- food costs are too high
Industry standards dictate restaurant CoGS fall between 20% and 40%, usually higher on food and lower at the bar. By calculating CoGS weekly, you can order inventory more accurately and take measures to control inventory costs before they start biting into your profit.
How to calculate your CoGS
CoGS for the period =
(Beginning Inventory of F&B) + (Purchases) – (Ending Inventory)
Here’s an example:
Let’s say you began with an inventory valued at $6,000. You purchased $2,000 in inventory at the beginning of the week. At the end of the week, you had inventory worth $4,000.
CoGS for the period = $6,000 + $2,000 – $4,000
CoGS for the period = $4,000
Now that you know your CoGS was $4,000, you can compare this number to what should have happened – also known as theoretical CoGS – and work to narrow the gap.
2. Labor Cost Percentage
What does labor cost percentage measure?
Labor cost percentage is the percentage of your revenue that pays for labor.
Why labor cost percentage is important to measure
Labor cost percentage is one of two key components of your prime costs (the other is cost of goods sold). Together they should make up about 60% of a healthy restaurant’s total costs, with a healthy labor cost percentage of about 20%–35% of sales.
How to calculate your labor cost percentage
Labor Cost Percentage = Labor / Sales
Here’s an example:
Let’s say you’ve added all money paid out to salaried employees and hourly employees over a week, including expenses like workers’ compensation, benefits, taxes, and insurance. The total was $5,500. During that same time period, the business brought in $22,000 worth of revenue.
Labor Cost Percentage = $5,500 / $22,000
Labor Cost Percentage = 25%
You can even use our easy-to-use labor cost restaurant calculator to help you calculate your total labor cost.
Improving Your Labor Cost Percentage
To obtain an even better handle on your labor costs, break out your front of house (FOH), back of house (BOH), and even managerial salaries so that you can control those elements even more closely. Your FOH manager can then compare the scheduled hours of FOH staff to the actual hours, with the goal to improve these numbers on a weekly basis. Likewise, the executive chef can do the same for the BOH staff to really create a well-oiled machine.
3. Prime Cost
What does prime cost measure?
Your prime cost is the total sum of your labor costs and your cost of goods sold (CoGS), including all food and liquor costs.
Why prime cost is important to measure
Prime cost is important to calculate (and monitor with a parent’s eye for fibs) because:
- It represents your largest expenses
- You have control over it (though it can quickly and easily get out of control)
- It affects your entire operations, including how you price your menu, schedule your staff, create your budget, and establish your goals
Full service restaurants try to keep their prime costs at about 60%. Above 70% means your costs are too high, and you could quickly find yourself in financial trouble. A number below 55% means you could be sacrificing quality or running your staff into the ground.
How to calculate your prime cost
Prime Cost = CoGS + Total Labor Cost
Here’s an example:
Let’s say you have a CoGS of $12,000 and a labor cost of $8,000.
Prime Cost = $12,000 + $8,000
Prime Cost = $20,000
To get the full story, let’s turn prime cost into a percentage against sales, to get prime cost ratio.
Let’s say we have sales of $31,500.
Prime Cost Ratio = (Prime Cost / Total Sales) x 100
Prime Cost Ratio = ($20,000 / $31,500) x 100
Prime Cost Ratio = (0.63) x 100
Prime Cost Ratio = 63%
Not bad! If this was your restaurant, you’d want to make some adjustments to shave off that extra 3%.
4. Break-Even Point
What does a break-even point measure?
Your break-even point is your tipping point. This metric represents how much revenue your business needs to earn to cover your expenses.
Why a break-even point is important to measure
If you’re consistently spending more than you’re earning, you can kiss your restaurant goodbye! Once you know your break-even point, you also know when you’ve covered your costs and started generating profit.
How to calculate your break-even point
Break-Even Point =
Total Fixed Costs / ( (Total Sales – Total Variable Costs) / Total Sales)
Here’s an example:
Let’s say your restaurant does $8,000 in sales over a four-week period. During that same period, you pay $1,200 in variable costs and $1,800 in fixed costs.
Break-Even Point = $1,800 / ( ($8,000 – $1,200) / $8,000)
Break-Even Point = $1,800 / ($6,800 / $8,000)
Break-Even Point = $1,800 / $0.85
Break-Even Point = $2,117.65
Your break-even point is $2,117.65. Break this barrier and you break into profit.
5. Food Cost Percentage
What does food cost percentage measure?
Food cost percentage is the difference between what it costs to produce an item and its price on the menu.
Why food cost percentage is important to measure
Industry standards dictate that restaurants keep a food cost percentage between 20% and 40%, with most restaurants aiming to keep food cost percentage around 30%.
When pricing your menu, it’s important to build out your prices with your ideal food cost percentage as your base. This way, each dish accounts for the cost of its ingredients and leaves an acceptable margin for other overhead costs and profit.
Monitoring your food cost percentage on an ongoing basis allows you to catch rising supplier costs, issues with portioning, spoilage, and shrinkage before any changes affect prime costs and profits.
How to calculate your food cost percentage for pricing your menu:
Food Cost Percentage = Item Cost/Selling Price
Food Cost Percentage Example
Let’s say your house burger and fries is $13 and costs $4 to make.
Food Cost Percentage = $4 / $13
Food Cost Percentage = 31%
Your mobile POS should be able to further break this down for you by day and menu item, like in this example:
The Thirsty Bartender
From: Monday, Jun 4, 2018, 12:00 AM
To: Monday, Jun 4, 2018, 11:59 PM
Food Cost Report
Chicken & Rice x 4
Sales: $56.00
Cost: $14.00 (25.0%)
Irish Stew x 2
Sales: $25.90
Cost: $6.00 (23.2%)
Avocado Pesto Linguine x 2
Sales: $24.00
Cost: $4.00 (16.7%)
6. Contribution Margin
What does contribution margin measure?
Contribution margin measures how much profit you’re making on one individual menu item – the revenue leftover after the cost of ingredients has been subtracted.
Why contribution margin is important to measure
Contribution margin is the dollar amount each dish contributes to your restaurant’s revenue after the cost of ingredients. Knowing this important restaurant KPI helps you strategically price menu items.
How to calculate your contribution margin
Contribution Margin = Selling Price – Cost of Ingredients
Here’s an example:
Let’s say you’re selling salmon burgers for $16 on your menu, and each costs $5.50 to produce.
Contribution Margin = $16 – $5.50
Contribution Margin = $10.50
Each salmon burger contributes $10.50 to cover your overhead costs, including labor, rent, utilities, and more.
Quick POS tip:
On your mobile POS, run a report that shows your total menu item sales and individual contribution margins so you can compare the top menu items and their actual contribution margin.

Drive your business with sales reports, food costs, customer satisfaction survey, and more.
7. Earnings Before Interest, Taxes, Depreciation, and Amortization (EBITDA)
What does EBITDA measure?
EBITDA represents earnings that are a result of operations only. The calculation strips away the effects of financing, accounting, and capital spending for better comparability between restaurants.
Why EBITDA is important to measure
Generally, EBITDA is a health check on your restaurant’s earnings from its operations. The metric is also used as a tool to:
- Compare restaurants
- Determine whether to buy, sell, or invest in a restaurant
- Prove operational performance when trying to acquire financing
- Tempt investors to invest in your restaurant business
How to calculate your EBITDA
Calculating EBITDA is best left to the experts. But, for your general knowledge, accountants will calculate EBITDA in one of two ways.
1. EBITDA formula based on operating profit:
EBITDA = Operating Profit + Amortization Expense + Depreciation Expense
2. EBITDA formula based on net income:
EBITDA = Net Income + Interest + Taxes + Depreciation + Amortization
8. Gross Profit & Gross Profit Margin
What does gross profit measure?
Gross profit represents the money your restaurant makes after deducting the costs of goods sold. It can be shown as number or a percentage (margin).
Why gross profit is important to measure
With CoGS deducted, gross profit tells you how much capital you have left to pay rent, labor, and other overhead expenses. When used as a key performance indicator, most restaurants aim for a gross profit margin of around 70%.
How to calculate your gross profit
To calculate your gross profit margin, you can use our free restaurant profit margin calculator, or do it manually using the formula below.
Gross Profit = Total Revenue – CoGS
Gross Profit Margin = (Gross Profit / Total Revenue) x 100
Here’s an example:
Let’s say you have $7,000 in revenue for one week. During that time, your CoGS was $3,000.
First, you’d calculate your gross profit.
Gross Profit = $7,000 – $2,000
Gross Profit = $5,000
Then, you’d calculate your gross profit margin.
Gross Profit Margin = ($5,000 / $7,000) x 100
Gross Profit Margin = 0.71 x 100
Gross Profit Margin = 71%
9. Inventory Turnover Ratio (ITR)
What does inventory turnover ratio measure?
Inventory turnover ratio refers to the number of times your restaurant has sold out of its total inventory during a period of time.
Why inventory turnover ratio is important to measure
You need to keep tabs on how often you use your entire inventory to prevent overstocking or understocking your shelves. Overstocking inventory can lead to waste – of food and money. Understocking inventory can mean a lot of 86’d menu items and unhappy customers.
Typically, most restaurants that have fresh ingredients aim to turn their inventory over less than seven days or between four and eight times per month.
How to calculate inventory turnover ratio
Inventory Turnover = CoGs / ( (Beginning Inventory + Ending Inventory) / 2)
Note: (Beginning Inventory + Ending Inventory) / 2 is the equation for Average Inventory.
Inventory Turnover Rate Example
Let’s say your CoGS for the month is $30,000. You started with $6,000 worth of inventory and ended with $3,000.
Inventory Turnover = $30,000/ ( ($6,000 + $3,000) / 2)
Inventory Turnover = $30,000/ ($9,000 / 2)
Inventory Turnover = $30,000/ $4,500
Inventory Turnover = 6
This means that, on average, you turn your inventory over six times per month.
10. Menu Item Profitability
What does menu item profitability measure?
The calculation for menu item profitability tells you which items on your menu have soaring profits… and which ones are flopping.
Why menu item profitability is important to measure
Similar to food cost percentage, menu item profitability is another way to gauge the performance of a menu item. With that information, you can compare items and make moves to highlight highly profitable dishes on your menu or focus on upselling.
How to calculate menu item profitability
Menu Item Profitability = (Number of Items Sold x Menu Price) – (Number of Items Sold x Item Portion Cost)
Here’s an example:
Let’s say you sold 17 portions of Nonna’s Lasagna one night. Each plate costs $4 to make and sells for $15.
Menu Item Profitability = (17 x $15) – (17 x $4)
Menu Item Profitability = 255 – 68
Menu Item Profitability = $187
From there, you could compare the menu item profitability of Nonna’s Lasagna to other items like Grandpa’s Pork Chops and rank items by both profitability and popularity.
11. Net Profit Margin
What does net profit margin measure?
Your net profit margin represents the money your restaurant makes after accounting for all operating costs, including CoGS, labor, rent, equipment, hardware, and utilities.
Why net profit margin is important to measure
Being profitable opens up a world of possibility for growth, expansion, investors, and even selling your business for a pretty penny.
Any profit is cause to celebrate, but 6% is the average restaurant profit. Of course, profit margins vary by concept.
How to calculate your net profit margin
Net Profit Margin = (Gross Sales – Operating Expense) / Gross Sales
Note: (Gross Revenue – Operating Expenses) is your net income. So, this calculation can also be expressed as: (Net Profit Margin = Net Income / Gross Sales).
Here’s an example:
Let’s say your gross sales are $7,000 over a one-month period. During the same period, your operating expenses cost you $5,000 to pay all your bills (CoGS, labor, operating expenses, rent, etc.).
Net Profit Margin = ($7,000 / $6,800) / $7,000
Net Profit Margin = $200 / $7,000
Net Profit Margin = 2%
Increase Sales or Cut Costs?
Okay, 2%. Not great, but not the worst. A profit is a profit is a profit. Your next move would be to find ways to increase that number – without sacrificing service or quality – through increasing sales (hello, marketing!) or cutting costs.
12. Overhead Rate
What does overhead rate measure?
Overhead costs are the opposite of prime costs. You can control prime costs, but they’re in constant flux. Overhead is not. Overhead includes fixed costs and operational expenses like your rent or mortgage, utilities, property taxes, licenses, fees, and permits. Your overhead rate is the amount you’re paying for fixed costs over a given period of time.
Why overhead rate is important to measure
Building overhead costs into your menu pricing and your daily/weekly/monthly/yearly sales goals will ensure you’re always covering your bases.
Note: Your overhead rate will fluctuate slightly month to month, and even by week, to account for holidays and short months.
Generally, restaurants aim for an overhead rate of about 30% of revenue.
How to calculate your overhead rate
Overhead Rate = Total Fixed Costs / Total Amount of Hours Open
Here’s an example:
You’ve added up your monthly bills for rent, gas, electric, hydro, cleaning, music licensing subscription, and all other fixed monthly costs. The total came to $10,000. During the month, you were open for a total of 380 hours.
Overhead Rate = $10,000 / 380
Overhead Rate = $26.31
You’re paying $26.31 per hour in overhead costs.
Performance Metrics & Costs
13. Average Cover (or Restaurant Revenue per Seat)
What does average cover measure?
Average cover measures the average amount a single customer spends at your restaurant.
Why average cover is important to measure
Average cover tells you how effective your serving staff are at maximizing sales, regardless of a server’s section size or turnover. You can also use average cover to predict and forecast future sales by considering the metric alongside your average customer headcount. (More on this metric next!)
How to calculate your average cover
Average Cover = Total Sales / Number of Covers
Here’s an example:
Let’s say your star server Nancy had $500 in dining room sales and served 13 guests in total. New hire Julia, on the other hand, had $600 in dining room sales but had 25 guests in total.
Nancy’s average cover was:
Average cover = $500 / 13 covers
Average cover = $38.46
Julia’s average cover was:
Average cover = $600 / 25 covers
Average cover = $24.00
As you can see, while Julia had higher total sales, Nancy’s average cover was much higher. As a manager, you’d want to consider giving Julia some selling techniques so she can optimize each opportunity to upsell.
14. Average Customer Headcount
What does average customer headcount measure?
Average customer headcount tells you how many customers you’ve served during a specific period of time.
Why average customer headcount important to measure
Calculating average customer headcount, you can anticipate busy and slow periods. Look at this metric alongside the average revenue per seat metric to forecast revenue targets and cash flow projections. Tracking average headcount can help you make better scheduling, inventory, promotion, and spending decisions.
How to calculate your average customer headcount
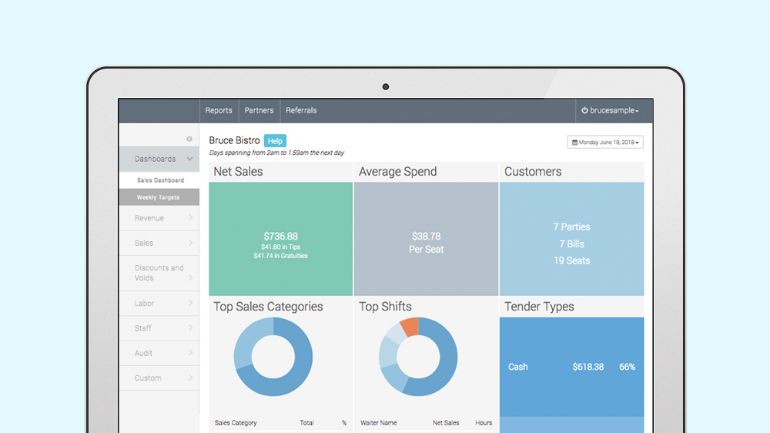
If you’re using a mobile POS, you can easily pull this information from your reporting and analytics dashboard. You can also adjust the time period to see headcounts by time of day, day, week, month, or season and then compare those numbers year-over-year.
When you identify times with consistently higher customer headcounts, you can:
- Schedule extra staff
- Better match inventory with demand
- Run a special or promotion to increase check totals
When you identify times with consistently lower customer headcounts, you can:
- Reduce staff
- Create a marketing campaign to get more people in the door

Drive your business with sales reports, food costs, customer satisfaction survey, and more.
15. Employee Turnover Rate
What does employee turnover rate measure?
Calculating your employee turnover rate refers to the frequency at which employees leave your restaurant over a period of time, including resignations, dismissals, and retirement. Employee turnover rate doesn’t include transfers, promotions, or other internal moves.
Why employee turnover rate is important to measure
Your employee turnover rate can expose underlying issues within your workplace, management function, and culture. A high turnover rate could mean that employees aren’t happy, your work culture needs some love, or you need to rethink who you’re hiring.
Also, turnover is costly: onboarding new staff takes time, money, and resources. According to the estimates made by the Center for Hospitality Research at Cornell, staff turnover can cost as high as $5,864 per employee. For some restaurants, staff turnover could mean as much as $146,600 annually.
How to calculate your employee turnover rate
Employee Turnover Rate = (Employees Departed / Number of Employees) x 100
Calculating different time periods:
To calculate monthly, quarterly, or yearly turnover, simply adjust your figures to account for the period you wish to view.
Here’s an example:
Let’s say it’s September, the end of your busy season. Thirteen of your summer staff have gone back to school. You have 22 full-time and part-time staff left.
Employee Turnover Rate = (13 / 22) x 100
Employee Turnover Rate = 0.59 x 100
Employee Turnover Rate = 59% for September
That’s more than half your staff! If your restaurant is truly seasonal, this might be expected. But if a high employee turnover occurs out of the blue, you should investigate.
16. Revenue per Available Seat Hour (RevPASH)
What does revenue per available seat hour measure?
Revenue per available seat hour (RevPASH) measures how each seat in your restaurant is performing.
Why revenue per available seat hour is important to measure
If a seat is unoccupied, you’re missing a revenue-generating opportunity. At 6:00 pm on a Friday, you’re likely to have more seats filled than at 2:30 pm on a Monday. When you measure RevPASH, you take this into consideration.
How to calculate your revenue per available seat hour
First calculate your seat hours.
Seat Hours = Number of Seats x Hours Open
RevPASH = Revenues / Seat Hours
Here’s an example:
Let’s say your restaurant seats 76 people and is open from 11:00 am to midnight every day (13 hours).
Seat Hours = 76 x 13
Seat Hours = 988
Let’s say you pulled in $5,600 of revenue on Tuesday.
RevPASH = Revenues / Seat Hours
RevPASH = $5,600 / 988
RevPASH = $5.67
This means each seat is making $5.67 an hour. If on Wednesdays your RevPASH is $10.25, you’ll want to find a way to increase RevPASH on Tuesdays by increasing your turnover or getting more people in the door.
17. Revenue per Square Foot (Sales per Square Foot)
What does revenue per square foot measure?
Average revenue per square foot measures sales volume, an indicator of your profit generating power.
Why revenue by square foot is important to measure
Calculating revenue per square foot tells you how efficiently you’re generating sales, which can be used to showcase your potential for expanding your restaurant or adding a location.
According to Bloom Intelligence, benchmarks for a full service restaurant are as follows: Losing money: $150 or lessBreak-even: $150-$250Profit: $250+ (5%-10% of sales)
How to calculate your revenue by square foot
Sales per Square Foot = Annual Sales / Square Foot
Here’s an example:
Let’s say your restaurant sold $850,000 last year. Your restaurant occupies 1,000 square feet.
Sales per Square Foot = $850,000 / 1,000
Sales per Square Foot = $850
You’re making a profit!
18. Table Turnover
What does table turnover measure?
Table turnover measures the numbers of tables turned over during a specific time period.
Why table turnover is important to measure
A quick turnover means more money in your pocket because you can serve more guests (as long as you’re busy). By knowing your average table turnover, you can:
- Help staff turn tables more efficiently
- Prepare your kitchen for the evening service
- Equip hosts with more information for reservation scheduling and wait times
There is no one size fits all, but typically you want to turn tables over consistently but comfortably throughout an evening. If you know the average guest takes two hours to have dinner and your dinner period goes from 5:00 pm to 10:00 pm, you’d hope to turn all tables over at least twice.
How to calculate your table turnover
Table Turn Time = Number of Guests Served* / Number of Seats
*During a specific period of time.
Here’s an example:
Let’s say you served 87 guests over the course of the evening and your restaurant has the capacity to seat 30 guests.
Table Turn Time = 87 / 30
Table Turn Time = 2.9
You’re turning your tables over 2.9 times over the course of an evening.
19. Time per Table Turn
What does time per table turn measure?
Time per table turn measures the average time a table is seated for.
Why time per table turn is important to measure
Time per table turn has a number of uses. It can:
- Help hosts when taking reservations and providing guests with wait times
- Tell you if servers are turning over tables fast enough to maximize revenue (without rushing guests, of course)
How to calculate time per table turn
Your POS should track the time between when a server first inputs an order and when that table cashes out. Using this data, your POS can give you an average time according to breakfast, lunch, and dinner.
Here’s an example:
If you’ve found that your average time per table turn is 50 minutes over lunch but 90 minutes over dinner, you could tell your serving staff they need to move faster and swifter over lunch but slow down over the dinner to provide a more leisurely experience.
Customer Metrics & Costs
20. Customer Acquisition Cost (CAC)
What does customer acquisition cost measure?
Customer acquisition cost (CAC) is a marketing metric that shows how much it costs you to get a new customer in the door.
Why customer acquisition cost is important to measure
CAC tells you whether the marketing initiatives you’re running are effective. CAC is especially useful if you’ve already measured some marketing campaigns and are looking at running new ones. By calculating and comparing the CAC of different campaigns, you can prioritize the campaign types that have had the best return on investment.
How to calculate your customer acquisition cost
CAC = Marketing Expenses / Total New Customers Acquired
Simple in theory. Not so much in reality. Your marketing expenses have to account for discounts, human resources, advertising fees, print fees, and more. But counting new customers that come specifically from your marketing initiatives is a lot easier with a POS that tracks discounts and coupon codes and can supply helpful reports.
Here’s an example:
Let’s say you’re running a Yelp ad offering $5 off your next dinner. After the promotion has ended, you learn that the discount code was used 15 times.
Marketing Expenses =
Discount Code Expense: $75 ($5 coupons x used 15 times)
Yelp Ad Fee: $200
CAC = ($75 + $200) / 15
CAC = $275 / 15
CAC = $18.30
Improving Your Customer Aquisition Cost
From here you need to determine whether $18.30 would be considered successful. How does the CAC of this campaign stack up against other promotional campaigns?
21. Customer Retention Rate
What does customer retention rate measure?
You might be attracting new customers, but are you keeping them? This restaurant calculation tells you how many customers you’ve retained.
Why customer retention rate is important to measure
Acquiring new customers is more expensive than keeping them. Studies show that loyal customers spend up to 67% more than a new customer. Repeat business shows you’re doing something right and getting rewarded for it. According to the Harvard Business School, “increasing customer retention rates by 5% increases profits by 25% to 95%.”
There’s no one size fits all for retention, but the higher the better.
How to calculate customer retention rate
Customer Retention Rate =( (Total Customers – Total New Customers) / Total Customers) x 100
Here’s an example:
Looking at your POS, you discover that last month you had 1,379 customers total. If you’re using a loyalty program, you can find out how many of those customers were returning ones by the number of people who visited more than once. From there, you find out that 929 of your customers were net new customers.
Customer Retention Rate = ( (1,379 – 929) / 1379) x 100
Customer Retention Rate = (450 – 1,379) x 100
Customer Retention Rate = (.32) x 100
Customer Retention Rate = 32%
Live By Your Restaurant KPIs
Live by the numbers. Die by the numbers.
Dramatics aside, keeping a hawk eye on these restaurant KPIs and metrics will help you make better business decisions on everything from menu pricing to staffing.
Learn how to make the most of your restaurant reports
Sign up for our free weekly TouchBistro Newsletter
